Grafana Observability Platform
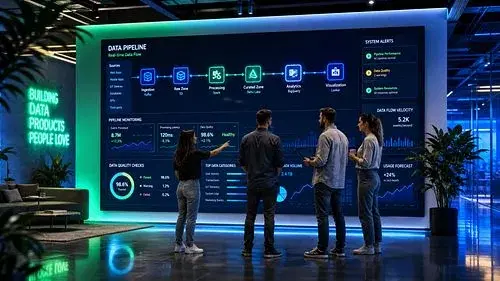
The open observability platform, delivered and operated by TMES. Grafana unifies metrics, logs, traces and profiles into one workspace — and TMES designs, implements, integrates and runs it for enterprises across Thailand and Southeast Asia.
TMES and Grafana Labs
TMES has partnered with Grafana Labs to deliver enterprise observability across Thailand and Southeast Asia. Grafana is used by organisations of every size — from startups to the Fortune 500 — and Grafana Labs was named a Leader in the 2026 Gartner® Magic Quadrant™ for Observability Platforms, positioned furthest in Completeness of Vision.
One Platform for Every Operational Signal
Grafana is the open observability platform that brings metrics, logs, traces and profiles together in a single place. Rather than replacing your data sources, it queries them where they live — Prometheus, cloud services, SQL databases, Snowflake, business systems — and turns them into shared dashboards, alerts and investigations.
TMES delivers Grafana as a complete capability, not just a licence. As a Grafana partner we can supply the Grafana Cloud or Grafana Enterprise subscription itself, then architect the deployment, instrument your applications and infrastructure, migrate you off legacy monitoring tools, build the dashboards your teams will actually use, and then operate the platform and the alert response under an agreed service level.
Platform at a Glance
What Sits Under the Dashboards
Grafana is a family of purpose-built open-source components, each optimised for one class of telemetry — assembled by TMES into a single coherent platform.
Grafana
Visualisation & dashboardsThe query and visualisation layer. Connects to more than a hundred data sources and renders them as shared, role-based dashboards for engineering, operations and executives.
Mimir & Prometheus
MetricsHighly scalable, long-term metric storage that is Prometheus-compatible — so existing exporters, recording rules and PromQL queries keep working as you scale.
Loki
LogsLog aggregation designed to be cost-efficient at scale by indexing labels rather than full log content — dramatically reducing the storage cost of long log retention.
Tempo
Distributed tracingHigh-volume trace storage that links a slow user transaction to the exact service, database query or third-party call responsible for the delay.
Pyroscope
Continuous profilingAlways-on code profiling that shows which functions consume CPU and memory in production — closing the loop between an incident and the line of code behind it.
Alloy & OpenTelemetry
Telemetry collectionA vendor-neutral collector that gathers metrics, logs, traces and profiles from your estate using open standards, so you are never locked into a proprietary agent.
How the Platform Fits Together
Six layers, from the systems you already run through to the people who answer the alert. Click any layer to see what it does.
Grafana Observability Architecture
How a signal travels from your systems to one screen — and to a response.
Cloud, Self-Managed or Hybrid
TMES will recommend the right model during the assessment, based on your data residency, scale and regulatory requirements.
Grafana Cloud
Fully managed by Grafana Labs, implemented and operated by TMES.
- Fastest path to production — no backend to run
- Elastic scale for metrics, logs and traces
- Built-in alerting, incident response and k6 performance testing
- Best for organisations without data residency constraints
Self-Managed Grafana
Grafana Enterprise or open source, deployed inside your own environment.
- Telemetry never leaves your network or country
- Deploy on your cloud account, private cloud or on-premise
- Full control of retention, access and data governance
- Best for regulated workloads and strict data residency
Hybrid
Sensitive telemetry stays local, the rest scales in the cloud.
- Keep regulated logs on-premise, send metrics to the cloud
- Single unified view across both tiers
- Phased migration path from legacy monitoring tools
- Best for large estates modernising in stages
Moving Off Your Current Monitoring Tool
Most organisations already have something in place. TMES migrates in phases and runs both systems in parallel until your operations team signs off — there is no cut-over weekend and no monitoring gap.
Host and service checks re-expressed as Prometheus targets and alert rules, with the check logic preserved but the maintenance burden removed.
Templates and triggers mapped to exporters and Grafana alert rules; historical trends kept available while the new platform builds its own history.
Agent-based collection replaced with OpenTelemetry and Grafana Alloy, typically the strongest cost case — you stop paying per host and per custom metric.
Network and infrastructure polling moved to SNMP exporters, with the NOC wallboards rebuilt as Grafana dashboards.
Log pipelines re-pointed at Loki for label-based indexing, usually cutting log storage cost substantially at the same retention.
Manual uptime checks, cron scripts and email alerts replaced with real instrumentation, proper alert routing and an on-call rota.
Inventory what the old tool actually watches
Export every check, dashboard and alert rule, then separate what is genuinely used from what has been ignored for years. This step alone usually removes a third of the estate.
Run Grafana in parallel
The new platform is instrumented and stood up alongside the incumbent. Nothing is switched off, so there is no window where you are blind.
Rebuild what matters
Dashboards and alert rules are rebuilt in Grafana with your operations team, tuned to reduce noise rather than replicate it one-for-one.
Verify, then decommission
Both systems run side by side through at least one full incident cycle. Once your team confirms parity, the legacy licence is retired.
What the Platform Delivers
Unified Dashboards
Role-based dashboards that combine infrastructure, application and business data on one screen, in English or Thai.
Alerting & Incident Response
Alert rules, deduplication, escalation policies and on-call schedules so incidents reach the right engineer with context attached.
Distributed Tracing (APM)
End-to-end transaction traces across microservices and APIs, linked directly to the logs and metrics from the same moment in time.
Log Aggregation & Search
Centralised, cost-efficient log storage with fast label-based search and retention policies aligned to your compliance requirements.
Synthetic & Performance Testing
Uptime checks from outside your network and k6 load testing, so capacity problems are found before a campaign or peak season, not during it.
Enterprise Data Integration
Connect Grafana to AWS, Alibaba Cloud, Kubernetes, SQL databases, Snowflake, POS and retail platforms, and existing ITSM tooling.

Every Signal, One Screen
Grafana links metrics, logs and traces together, so a team can walk from an anomalous graph to the exact log line behind it in a few clicks — without switching tools.
- Correlate signals across systems in one click
- Alerts arrive with context and an escalation path
- Open standards keep your telemetry portable
Managed Observability Service
Licence, implementation and ongoing operations from one accountable partner. Start with an assessment, deploy in phases, then hand the running of it to TMES — or take it in-house once your team is enabled.
Assess & Design
2–3 weeksUnderstand what you can see today, and what you cannot.
- Audit of current monitoring tools, coverage and blind spots
- Service and dependency mapping for critical business flows
- Target architecture and deployment model recommendation
- Licence and infrastructure cost modelling
Implement & Migrate
4–8 weeksStand up the platform and get real signal flowing.
- Grafana deployment, hardening and access control
- Instrumentation with Grafana Alloy and OpenTelemetry
- Dashboard, alert rule and escalation policy build
- Migration from legacy monitoring tools, with team enablement
Managed Observability
OngoingTMES runs the platform and answers the alerts.
- 24/7 platform operations and alert triage
- Monthly service reporting against agreed SLAs
- Continuous dashboard, alert and cost tuning
- Delivered under ISO 27001 / 27701 / 20000-1 governance
TMES can also supply the Grafana Cloud or Grafana Enterprise subscription directly, so licensing, deployment and day-to-day operations sit on one contract with one accountable partner — with local invoicing and support in Thailand.
Where Grafana Earns Its Place
Retail & F&B Store Estates
One dashboard covering every store, POS terminal, kiosk and payment integration, with alerts routed to the regional team responsible for that site.
Financial Services Digital Channels
Availability, latency and error-budget tracking for customer-facing apps and APIs, with retained evidence for IT resilience and audit reporting.
Cloud & Kubernetes Platforms
Cluster, node and workload visibility correlated with application traces to right-size capacity, control cloud spend and validate migrations.
Manufacturing & IoT
Plant equipment, sensor and edge-gateway telemetry in a single time-series platform, so production anomalies surface within seconds.
The TMES Advantage
Frequently Asked Questions
Q.What is Grafana?
Grafana is an open observability platform for collecting, visualising and alerting on operational data. It brings metrics, logs, traces and profiles into shared dashboards, connects to more than a hundred data sources, and includes alerting and incident response. It is the most widely adopted open-source dashboarding tool in the world.
Q.Is Grafana free?
Grafana OSS is free and open source, and many organisations start there. Grafana Cloud and Grafana Enterprise are commercial offerings that add managed backends, enterprise access control, support and advanced features. TMES helps you choose between them based on scale, compliance and the true cost of self-operating the stack.
Q.What is the LGTM stack?
LGTM refers to Grafana Labs core open-source components: Loki for logs, Grafana for visualisation, Tempo for traces and Mimir for metrics — often extended with Pyroscope for continuous profiling and Grafana Alloy for OpenTelemetry-based collection. Together they form a complete observability backend.
Q.Can Grafana replace our existing monitoring tools?
In most cases yes, and TMES runs it as a phased migration rather than a cut-over. We typically run Grafana alongside the incumbent tool for a period, rebuild the dashboards and alert rules that matter, verify parity with your operations team, and only then decommission the legacy licence.
Q.Can we buy Grafana licences through TMES?
Yes. As a Grafana partner, TMES can supply Grafana Cloud and Grafana Enterprise subscriptions alongside the implementation and managed service, with local invoicing and first-line support in Thailand. That puts licensing, deployment and 24/7 operations on a single contract instead of splitting them across a vendor, an integrator and an operations provider.
Q.Does TMES provide 24/7 support for Grafana in Thailand?
Yes. TMES offers Grafana as a managed observability service, including 24/7 platform operations, alert triage, monthly SLA reporting and continuous tuning — delivered from Thailand under ISO 27001, ISO 27701 and ISO 20000-1 certified governance.
Operated Under International Standards
Our managed observability service runs under ISO-certified information security, privacy and IT service management frameworks — independently verified by BSI Group.
Information Security Management
Structured risk management and data protection controls across all client engagements.
Privacy Information Management
Responsible data processing practices that reinforce client and partner trust.
IT Service Management
Service delivery governance aligned with IT service management best practices.
Software Engineering Lifecycle
Structured, repeatable and quality-governed technology project execution.
See Your Whole Stack in One Place
Request a Grafana demonstration or book an observability assessment with a TMES specialist to map your blind spots and design the right platform.